on
215 words - 2 minutes to read
Java - Monitoring the JVM with Spring Boot
Le problème
JLB has setup a Grafana on top of TimeScaleDB et InfluxDB (yeah, yeah, yeah, we’re having a lot of fun here, so what?).
Steph has built a Java/Spring Boot app and well it’d be nice to monitore it and be aware of what’s going on on the JVM side.
Spring Boot, like any good framework eases dev’s lives and can collect tons of metrics and expose over HTTP or the JMX : let me introduce: Actuator !
Adding Actuator’s dependency:
 dependencies {
   compile("org.springframework.boot:spring-boot-starter-actuator")
 }
and just tweak the config as you please, this article is quite exhaustive by the way.
So, Actuator has done half of the job already, let’s pull these data and store them in a time series database !
A solution
Actually, this is really straightforward.
- add a dependency,
- setup some config info,
- profit.
The aforementioned dependency :
dependencies {
    compile 'io.micrometer:micrometer-registry-influx:latest.release'
}
Extract from the conf :
management.metrics.export.influx.enabled=true
management.metrics.export.influx.uri=https://influx.example.com:8086
management.metrics.export.influx.auto-create-db=false
management.metrics.export.influx.db=db-name
management.metrics.export.influx.user-name=user-name
Since we’re responsible people and we’ve read this 12 factor app article, we don’t set the password in the configuration, right?
To set it up as an environment variable, we switch to all caps and replace the dot (.) by underscores (_):
MANAGEMENT_METRICS_EXPORT_INFLUX_PASSWORD='hi_i_m_the_password'
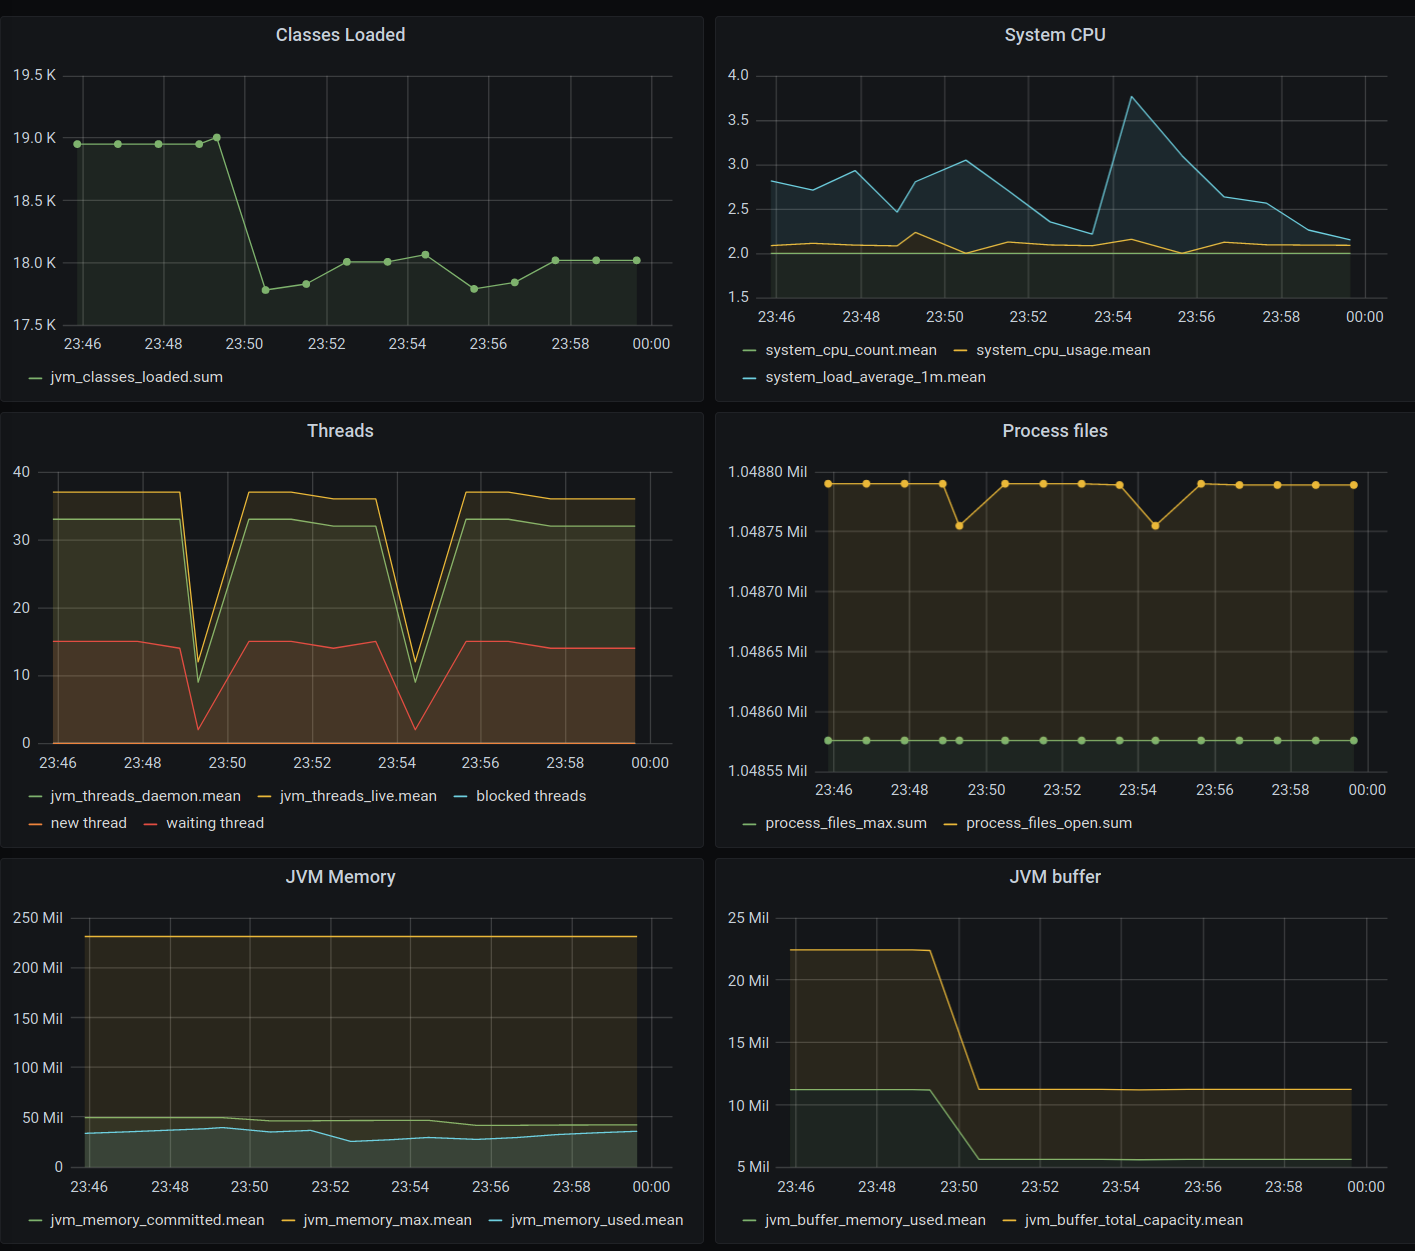
And voilà, with grafana, we can build a dashboard like this one super easily: